
Bad news if you live in the city of London — new research suggests that you have the highest carbon footprint per person in the entire UK! The article below, courtesy of the Carbon Brief, tries to figure out why.
If you live or work in City of London, it might be time to turn off the air-con and power down the PC. New research shows the 1.1 square mile region has the highest carbon footprint, per person, in all of the UK. While the average Brit produces 12.5 tonnes of carbon dioxide a year, emissions per head in the city of London are 25 per cent higher.
City slickers with big feet
The new study, just out in the journal Environmental Research Letters, uses data collected in 2004 to analyse which parts of the UK have the highest carbon footprints per person.
In this case, the carbon footprint includes both greenhouse gas emissions produced in the UK, through the use of fuel and electricity for example, and emissions released abroad in the process of manufacturing goods we import – sometimes called ’embodied emissions’.
The results show that both the biggest and smallest carbon footprints were found in London. The bankers, lawyers and guild members found in the City were responsible for emitting 15.5 tonnes of carbon dioxide a year. Londoners just eight miles away on the A1203 in the much more residential area of Newham were thriftier with carbon – producing just 10.2 tonnes of the potent greenhouse gas:
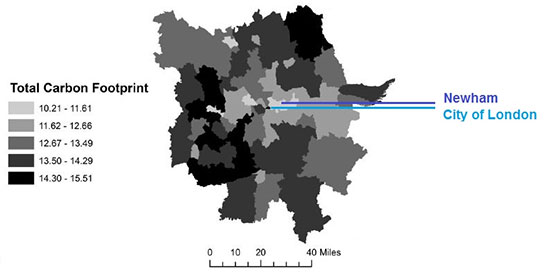
Carbon footprint (per capita) within a 50 mile radius of the City of London.
Location or lifestyle?
When the researchers compared the factors behind high carbon footprints, they found people’s lifestyle had the biggest effect, while things like being urban or rural, or the distance from industry were less important.
High salaries, good education and car ownership could all be linked to higher carbon footprints, the research found. This pattern emerges, say the authors, because more of our emissions are tied to the goods we use, and fewer come from the direct consumption of fuels at home.
But if embodied emissions aren’t factored into carbon footprints, the picture is slightly different. When the authors considered just the emissions produced in the UK, they found geographical factors had a much bigger impact. The highest carbon footprints in that case can be found in towns and cities in the North of England – areas which traditionally house a lot of the UK’s industry.
Embodied emissions matter
There hasn’t been much research looking at carbon footprints on a local level, so it’s worth being a bit cautious about these results. Equally, it’s important to note that the data used here is from 2004 – things may have changed a little in the last 10 years.
But they do give a good indication of where carbon footprints are highest and why. While the UK’s climate targets are largely focused on reducing homegrown emissions, this research shows a lot more of our carbon footprint comes from the goods we import. A similar conclusion was reached last year by the Department for Environment, Food and Rural Affairs, and again this year by the government’s own climate advisers.
The above article is taken from the Carbon Brief website, which you can read in full here.
Well there you have it! The affluent city area may have a high carbon footprint due to the embodied energy in expensive goods, but that doesn’t mean the rest of us are off the hook! The North of England (home to Go Greena’s head office) is responsible for a lot of carbon from manufacturing and heavy industry.
Which ever way you look at, another big carbon culprit is the energy used to heat and power our homes — regardless of where you live in the UK. That’s why the government have been relentlessly trying to get households to take advantage of free insulation schemes, including cavity wall and loft insulation.
You can read more about free insulation here, or book a free home energy assessment with Go Greena here.