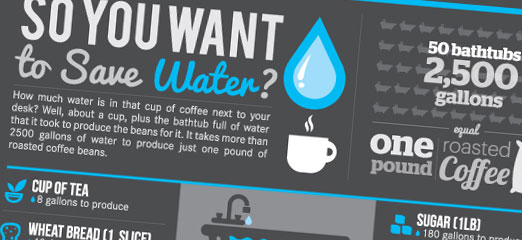
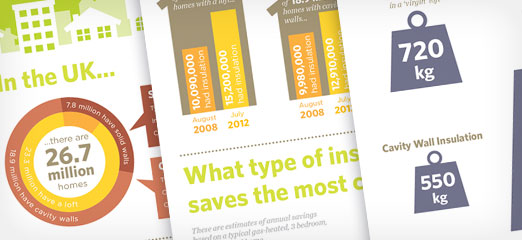
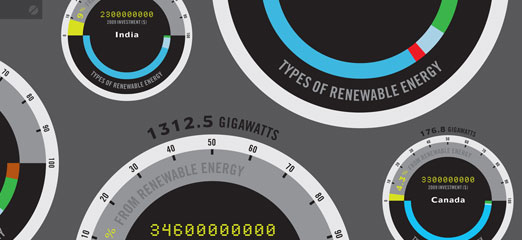
A surprising amount of water goes into producing some of the everyday things we consume, from T-shirts to chickens to car tyres. This infographic from Loch Ness Water Gardens reveals which products are the worst culprits, along with six handy tips to reduce your personal water footprint.
Green Energy Around The World
A belated happy new year from Go Greena! The team are all back from their Christmas break and ready to take your calls and provide your home energy surveys.
Following on from the popularity of this post from last year, we have put together another fine collection of infographics that show the state of the renewable energy industry here in the UK, in Europe and around the world. read on and enjoy!
Our Top 5 Energy Stories – 19th December 2012
In our final roundup of the year, we have solar panel building robots, scary infograhics, Mexican solar ovens, Hobbits and gravity-powered lighting!
Continue reading “Our Top 5 Energy Stories – 19th December 2012”
Infographic: What Has CERT Accomplished?
The Carbon Emissions Reduction Target (CERT) was introduced in August 2008, and is the main source of funding for the free products we offer at Go Greena. The infographic below illustrates the impact CERT has made over the last four years.
Our Top 5 Energy Stories – 17th October 2012
Our weekly roundup of renewable energy related stories from around the world.
Continue reading “Our Top 5 Energy Stories – 17th October 2012”
7 Impressive Renewable Energy Infographics
This week at Go Greena HQ we have been busily scouring the web for graphics, illustrations, diagrams and infographics that put green issues and energy saving into perspective. Below are seven of our favourites:
Continue reading “7 Impressive Renewable Energy Infographics”